Build a crosstab
A crosstab compares the answers to one question against the answers to another, such as how satisfaction differs by how people heard about you. Crosstab is on Growth and above. On lower plans it shows a padlock in the left menu and opens an upgrade prompt. You need access to the survey to build one, and the Editor role or higher to export it.
Build a crosstab
Section titled “Build a crosstab”-
Open the survey and click Responses in the top bar. If you need the steps, see See your survey’s results.
-
In the left menu, click Crosstab.
-
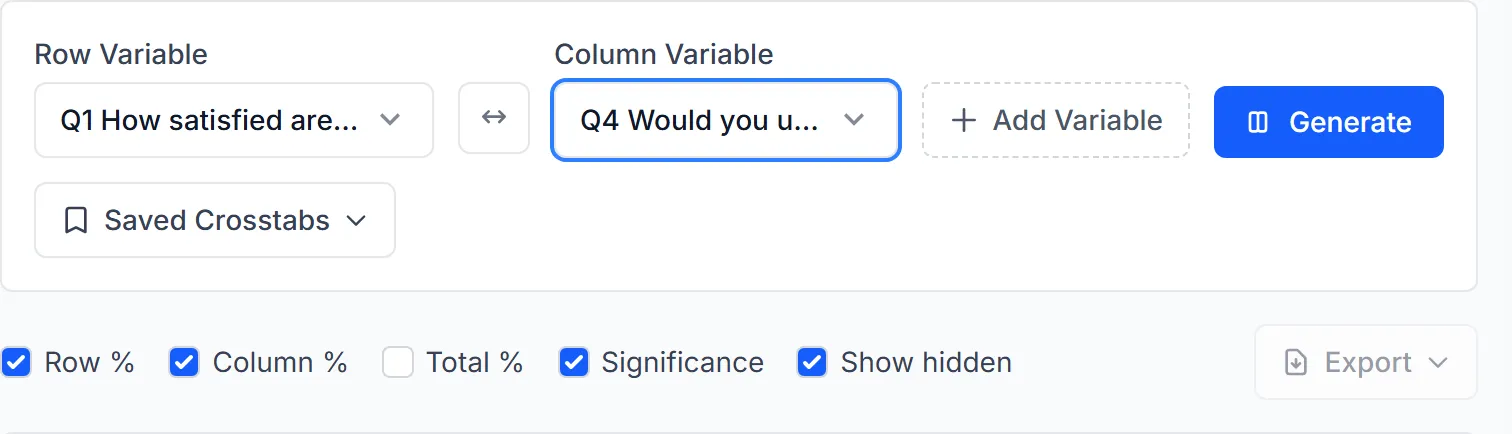
Under Row Variable, choose the question for the rows.
-
Under Column Variable, choose the question for the columns.
-
Click Generate.
The table appears below the options, with the significance test under it.
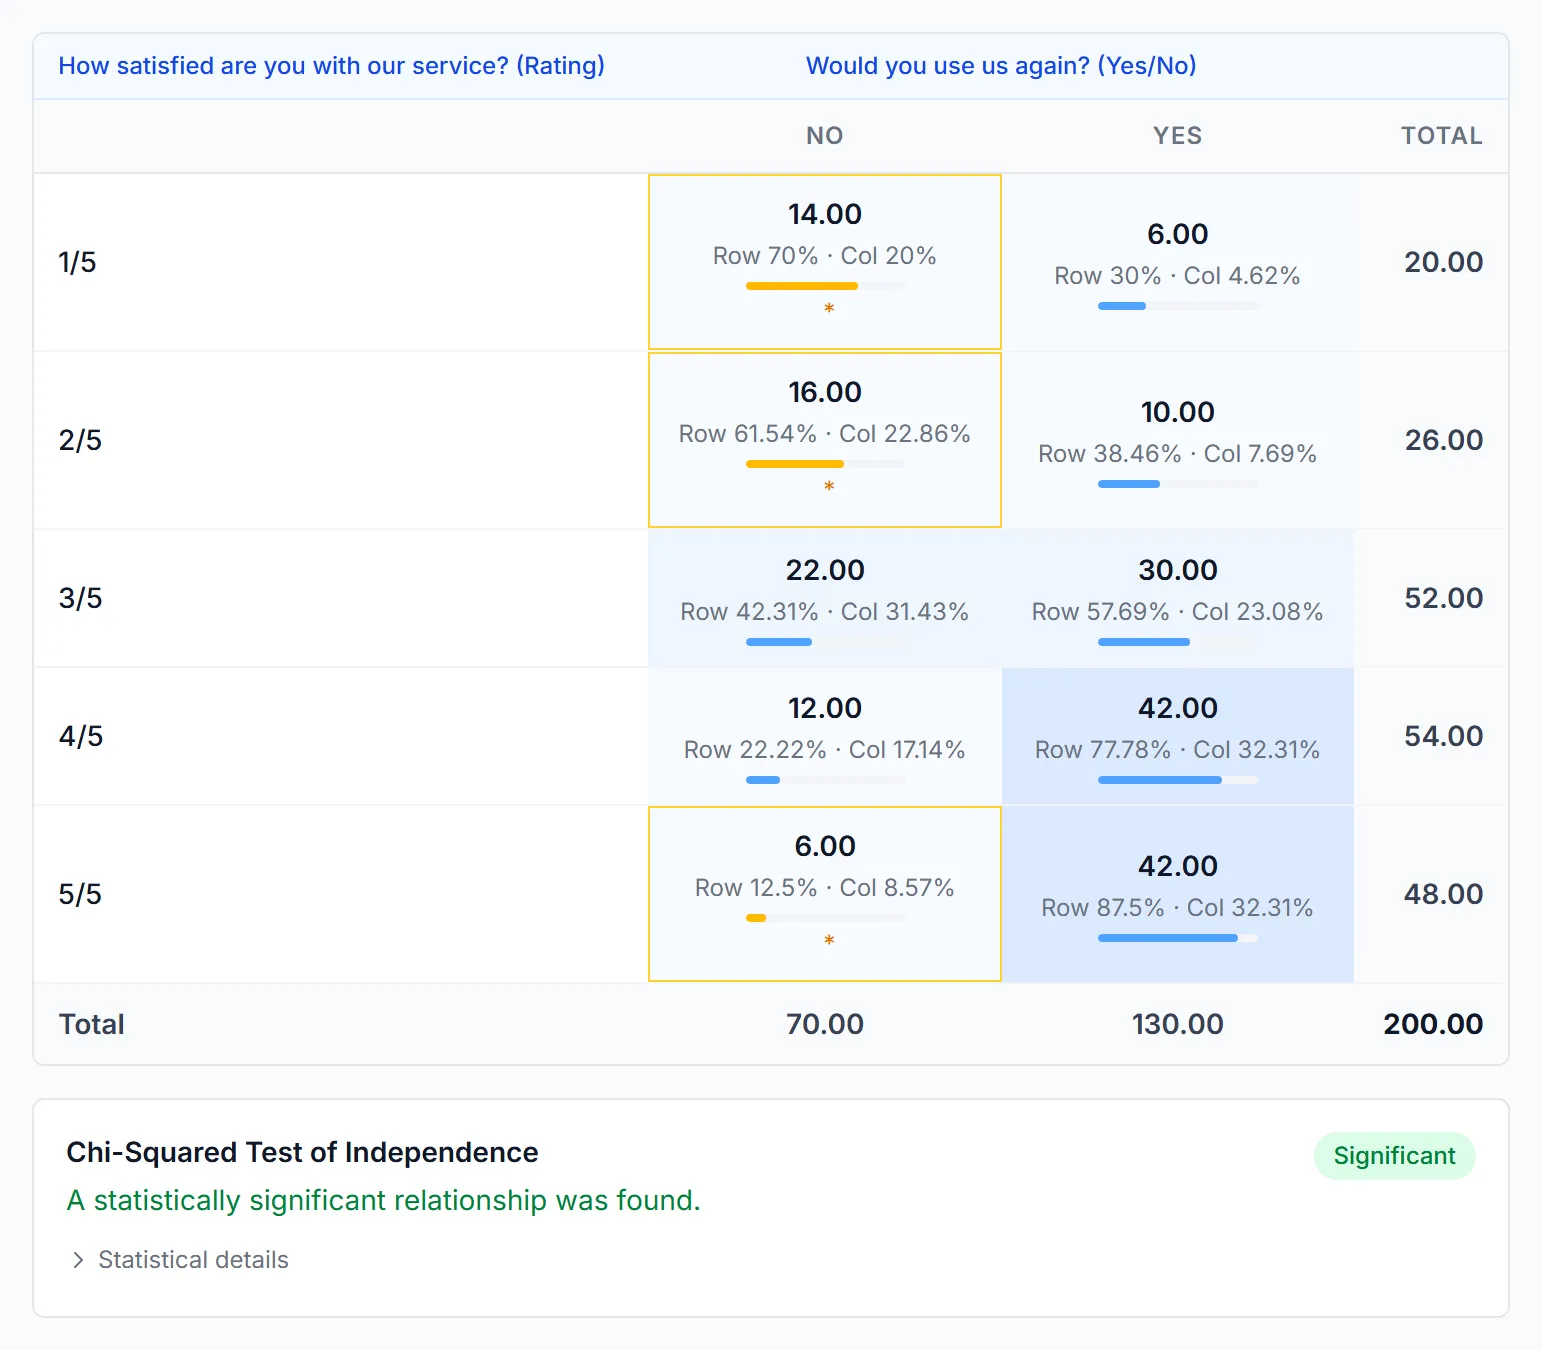
To turn the table around, click the swap button between the two lists. It swaps the rows with the first column and rebuilds the table.
What you can compare
Section titled “What you can compare”You can choose Multiple Choice, Image Choice, Yes/No, Rating, Slider, NPS and Matrix questions. Each statement of a Slider or Matrix question is its own entry in the list, such as Q3a and Q3b. To work with written answers, use Text Analysis.
Both lists end with a Respondent attributes group, which holds contact fields and embedded data. See Respondent attributes for the rules.
Add more columns
Section titled “Add more columns”- Click Add Variable. A new list appears under Column Variable.
- Choose the question.
- Click Generate.
You can have up to three column variables. They sit side by side in the table, each with its own Total column. To remove one, click the × beside it.
Read the table
Section titled “Read the table”Each cell can show:
- A count, in bold. It always has two decimal places, so 12 reads as 12.00.
- Row, Col and Total percentages: the cell’s share of its row, its column and the whole table.
- —, when nobody gave that combination of answers.
- Withheld, when the number is hidden to protect respondents. See Withheld cells.
When the whole table tests as significant, cells that stand out from what you’d expect if the questions were unrelated turn amber and get an asterisk.
The checkboxes above the table change what it shows. Your choices take effect straight away, with no need to click Generate.
| Checkbox | What it does | Starts |
|---|---|---|
| Row % | Shows each cell’s share of its row | On |
| Column % | Shows each cell’s share of its column | On |
| Total % | Shows each cell’s share of the whole table | Off |
| Significance | Shows the amber cells | On |
| Show hidden | Includes answers to choices and columns that were hidden after people had answered them, marked “(hidden)” | On |
The significance test
Section titled “The significance test”The panel under the table runs a Chi-Squared Test of Independence. It’s marked Significant when the p-value is below 0.05, and Not significant otherwise. Open Statistical details to see χ², df, the p-value and n.
Significant means the two questions’ answers are related in these responses. It doesn’t show that one causes the other. Amber warnings appear in the panel when the table has fewer than 30 responses, or when some cells have an expected count below 5. Read the result with more care when you see one.
A question that takes several answers changes two things. A person who chose more than one answer is counted under each, so totals count respondents and percentages can add up to more than 100%. A note under the table says so. The test also changes, and the panel names the method it used.
Withheld cells
Section titled “Withheld cells”A cell with fewer than 5 answers is not shown. Where needed, another cell in the same row or column is hidden too, so a hidden value can’t be worked out from the totals. That means a withheld cell can be any size. Row and column totals stay visible. This applies to every survey and can’t be turned off.
Value Grouping
Section titled “Value Grouping”A numeric question with more than 10 different answers is grouped into ranges. A Value Grouping card then appears below the test, with these controls for each grouped question:
- Show all values: turns grouping off.
- Bins: sets the number of ranges, from 2 to 20.
- Custom breakpoints…: lets you type your own Boundaries, separated by commas, and optional Labels. Click Apply to use them.
The table rebuilds when you change one. Your grouping lasts while the browser tab is open, and it resets if you choose a different question.
See who is in a cell
Section titled “See who is in a cell”- Click a cell that has a number. A panel opens and lists the respondents in that cell.
- Click a row in the panel to open that person’s answers in a new tab.
Withheld and empty cells can’t be opened, and a group with too few responses shows a message instead of a list. This works for the first column variable. To see who is in a cell of another column variable, make it the first one.
Filter the table
Section titled “Filter the table”Use the filter bar above the options. Once both variables are chosen, the table rebuilds when you change a filter. See Filter your results.
Export the table
Section titled “Export the table”- Build the table.
- Click Export.
- Choose CSV or Excel (.xlsx).
The file uses your current filter and Value Grouping, and holds every column variable. A withheld cell reads “Withheld” in the file too.
To keep a crosstab and reopen it later, see Save views and schedule reports.
Example
Section titled “Example”You ran a customer survey and want to know whether people who found you through search are happier than people who came through a friend. You choose the satisfaction rating as the Row Variable and “How did you hear about us?” as the Column Variable, then click Generate. Column % shows how each source’s answers spread across the ratings, and the test underneath says whether the difference is significant. To see only last month’s responses, you set Date Range and the table rebuilds.
Troubleshooting
Section titled “Troubleshooting”The page says “No supported questions.” The survey has no choice, rating or matrix question to compare. Text questions can’t be used in a crosstab.
Generate is greyed out. It needs a Row Variable and at least one Column Variable.
I clicked Generate and the starting message came back. The table couldn’t be built, and the page doesn’t say why. Two common reasons:
- A respondent attribute has more than 10 different values. Filter the responses first, or choose a field with fewer values.
- A filter on an anonymous survey matches too few completed responses. Widen the filter.
Most of the table says Withheld. The answers are spread too thinly. Compare questions with fewer answer options, use fewer Bins, remove a filter, or collect more responses.
Export does nothing. Exporting needs the Editor role or higher. Ask a workspace admin to change your role.
A contact field is greyed out in the list. It reads “not available, responses are anonymous” on an anonymous survey, or “not available, restricted field” if you aren’t allowed to see it. See Respondent attributes.
Crosstab shows a padlock. It needs the Growth plan or above.