After people take your survey, you’ll want to review what they have submitted in an organized manner so that you can create actionable next steps.
SurveyRock offers you several tools to analyze the results of surveys taken by your customers and clients. For additional advanced analysis we have long offered the ability to export your responses in the Excel or CSV file format. Now we’re pleased to let you know that you can now export your survey results data to the SPSS native file format (.sav).
SPSS is a widely used program for statistical analysis and is also used by market researchers, health researchers, survey companies, government, education researchers, marketing organizations, data miners and others. By using SPSS you can:
- Analyze and better understand your survey data and solve complex business and research problems
- More quickly understand large and complex data sets with advanced statistical procedures that help ensure high accuracy and quality decision making
- Use extensions, Python and R programming language code to integrate with open source software
Export Steps in SurveyRock
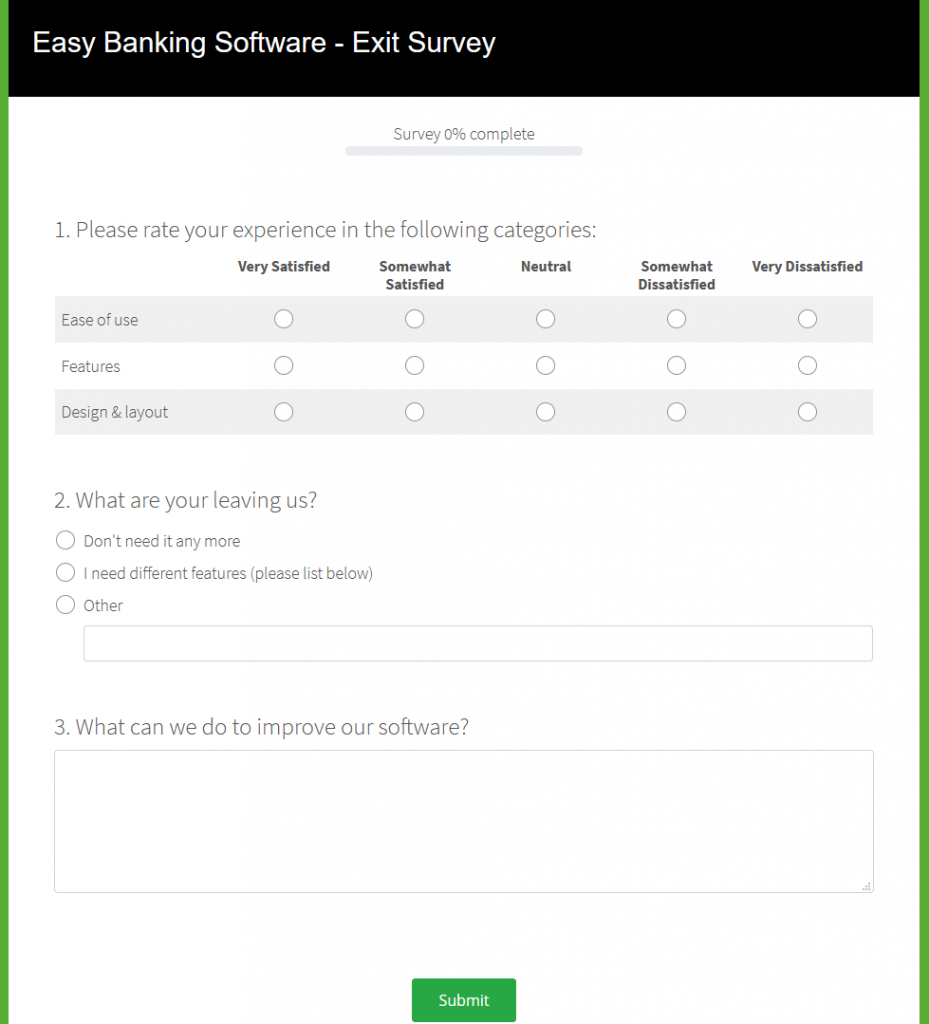
To show you how to export your data to SPSS, I just created a simple exit survey for a banking software application and submitted a few responses.
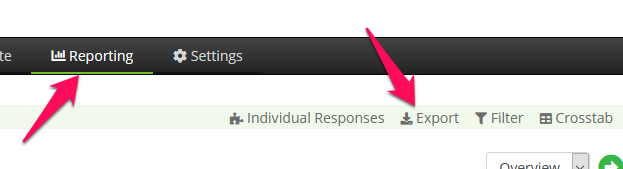
When you’re ready to export the responses, go to the Reporting section and click on Export.
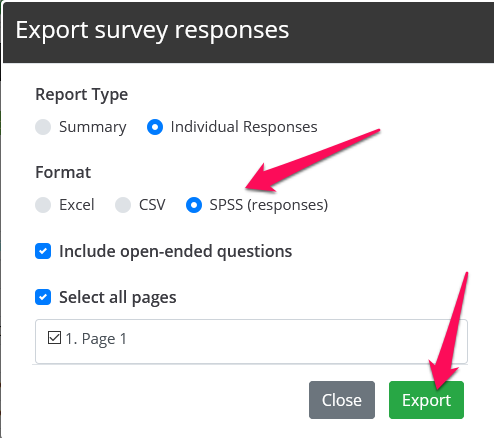
A pop-up window will open with the export menu. Choose SPSS (Individual Responses option will automatically be chosen), select Include open-ended questions if you want those included (text box and text line questions) and click Export at the bottom.
A window will pop-up asking if you want to save the file or open in SPSS. I started up SPSS and see the below screen.
SPSS Survey Overview

If you’re not familiar with the SPSS application layout, there are two primary views of your data structure: Data and variables. You can see this with the two tabs at the bottom left of the screenshot above. The Variable View shows you the field details (structure of your questions), such as field name, type, question label, etc. The Data View shows you the survey responses by question and respondent.
The first 5 fields are the same in every survey:
- Respondent ID: This is a unique ID for each of your survey respondents
- Start Date: The date and time that the user started the survey
- Finished Date: Date and time that the user finished the survey. This is empty if they have not yet completed it.
- IP Address: If you have chosen to gather IP addresses from your respondents, they will be displayed here
- Device Type: This is the kind of device used by the person taking the survey. Can be either Desktop, Tablet or Mobile.
The rest of the fields in the Variable View are different for each survey and represent each question.
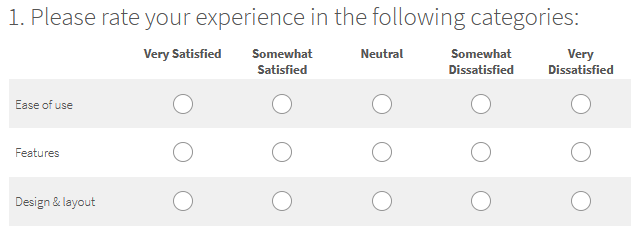
The first question in our example survey is a matrix-type (rating scale) question. Each row of the survey question is depicted as a separate row in the Variable View. The first row of the first question is automatically named “q001_001” and so on through “q001_003” since the first question has 3 rows. The column titles are attached to each of the three rows and can be seen by clicking on the Values cell (see screenshot below).

The second question in the survey is a simple multiple choice with two options as well as an ‘other’ type follow-up question. The Variable view shows this in the two fields just mentioned.
The final element of the survey is a general open-ended question “What can we do to improve our software?” This can be seen in the screenshot above as the last row and is a string type question.
Everything we have looked at so far in SPSS was to describe the questions and response data. If we click on the Data View tab at the bottom of the screen, we see the answers that our respondents submitted.

In the example above we can see that the first user chose the 2nd option for the first row of the matrix, the first option for the second row and the 3rd option for the third row. Since the option text is associated with the choice number, as mentioned previously, SPSS has the ability to show us the option label instead of simply the number. Simply click on “View” -> “Value Labels” in the application to enable this option. The data above is then transformed as seen below. So much more user friendly!

Now you can use the power of SPSS to analyze your survey responses!
Leave a reply